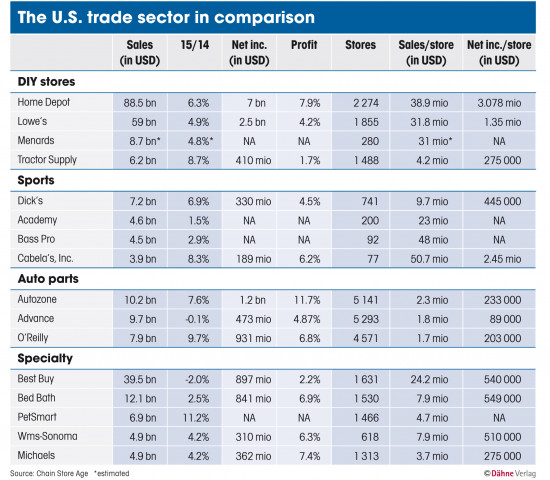
Included in the listing were specialty chains selling some of the kinds of products found in home centres and hardware stores - i. e. sporting goods, automotive accessories, pet supplies and household goods. In the accompanying spreadsheet, readers will have an opportunity to compare their operations with these specialists as well as with hardlines retailers.
The accompanying spreadsheet shows sales growth from 2014 to 2015, profit as a per cent of sales, and new data showing annual sales per store and then an even newer statistic, net profit per store, which divides total net profits by the number of stores. Admittedly, the profit per store does not account for online sales, but for most of the retailers shown in the spreadsheet, online sales are very minor.
Among the hardlines group, Home Depot's management is clearly superior, with profits well ahead of Lowe's overall and certainly on a per-store basis.
Among the various specialty retailers, sales growth and profitability vary widely.
About the author


